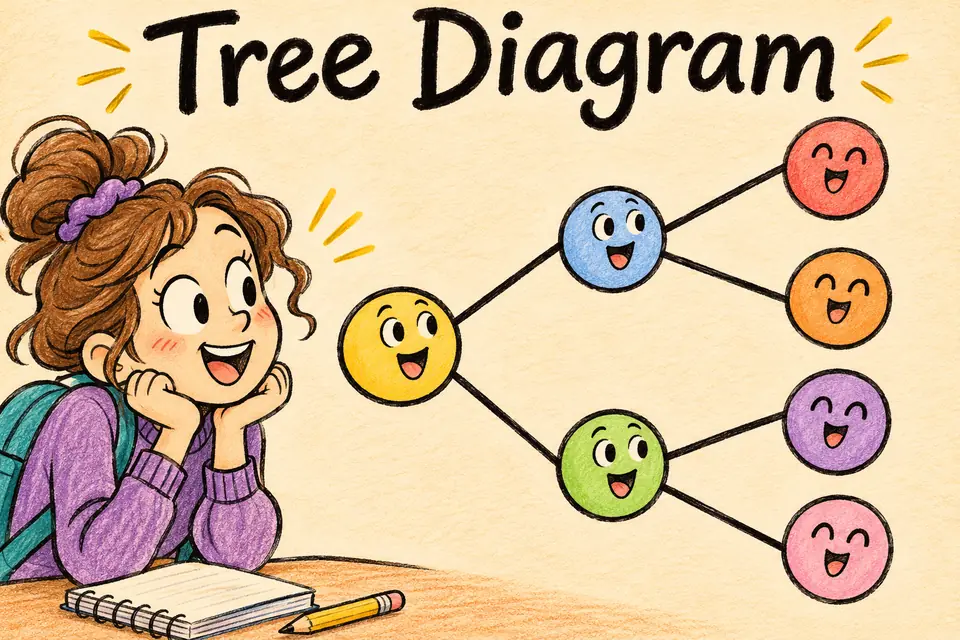
Tree Diagram definition
A tree diagram shows the possible outcomes of a process in branches, one stage at a time.
Tree Diagram in a picture
How it works
Follow a path from the start to the end to read a complete outcome. In a probability tree, branches leaving a node show the choices and probabilities at that stage. Multiply along a path. Add the probabilities of different completed paths when they count toward the same event.
Worked examples
List the paths for a red or blue shirt with black or white shoes.
Red–black, red–white, blue–black, blue–white.
What is the probability of HH with independent fair flips?
(1/2)(1/2) = 1/4.
What is the probability of exactly one head?
Add HT and TH. Each has probability 1/4, so the result is 1/2.
Common mistake
Multiply branch probabilities along one complete path. Add probabilities across separate completed paths.
Quick check
What does a branch represent?
Show answer
A possible result at that stage.
How many outcomes do two fair coin flips have?
Show answer
Four ordered outcomes.
Do branch probabilities always stay the same at the next stage?
Show answer
No. They can depend on what happened earlier.
Sources
Flashcard
Tree Diagram
Reveal the definition
A tree diagram shows the possible outcomes of a process in branches, one stage at a time.
Effortless Math. “Tree Diagram.” Math Dictionary.