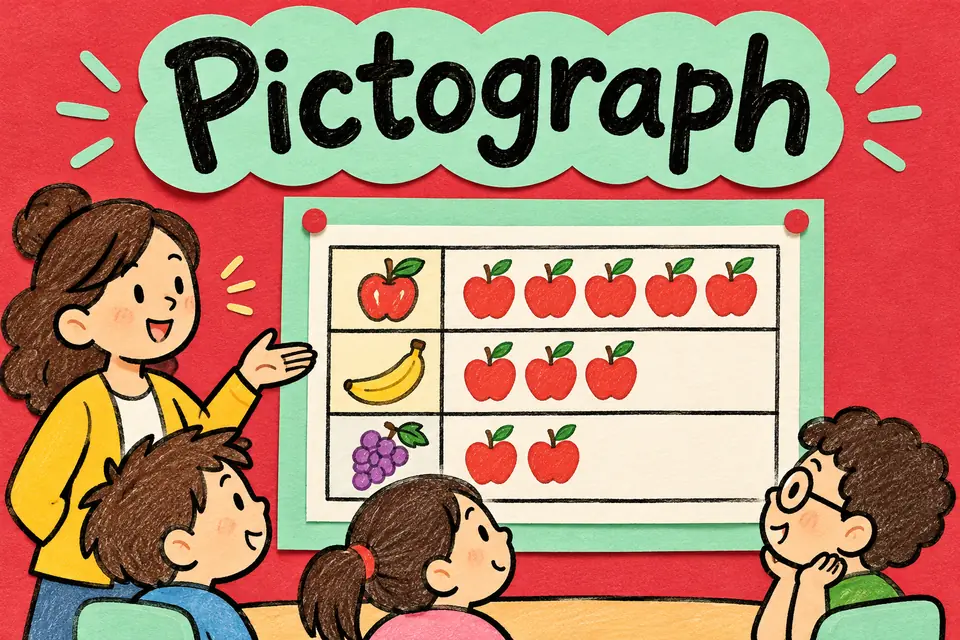
Pictograph definition
A pictograph uses pictures or symbols to show counts. Its key tells how much each picture represents. If one apple icon stands for two votes, three icons stand for six votes.
Pictograph in a picture
How it works
Choose a symbol value that fits the data and give all categories the same key. A half symbol represents half the value of a full symbol when the chart uses partial symbols.
Worked examples
Read four icons when each is worth 3.
Multiply 4 × 3 to get 12.
Show 10 votes with a 2-vote key.
Draw five icons, since 10 ÷ 2 = 5.
Read 2½ icons with a 4-vote key.
Two icons stand for 8, and half an icon stands for 2. The total is 10.
Common mistake
Read the key before counting. An icon can stand for more than one object.
Quick check
Three symbols each stand for 5 books. How many books?
Show answer
15.
Two symbols each stand for 4 votes. How many votes?
Show answer
8.
How many votes does half a 6-vote symbol represent?
Show answer
3.
Sources
Flashcard
Pictograph
Reveal the definition
A pictograph uses pictures or symbols to show counts. Its key tells how much each picture represents. If one apple icon stands for two votes, three icons stand for six votes.
Effortless Math. “Pictograph.” Math Dictionary.