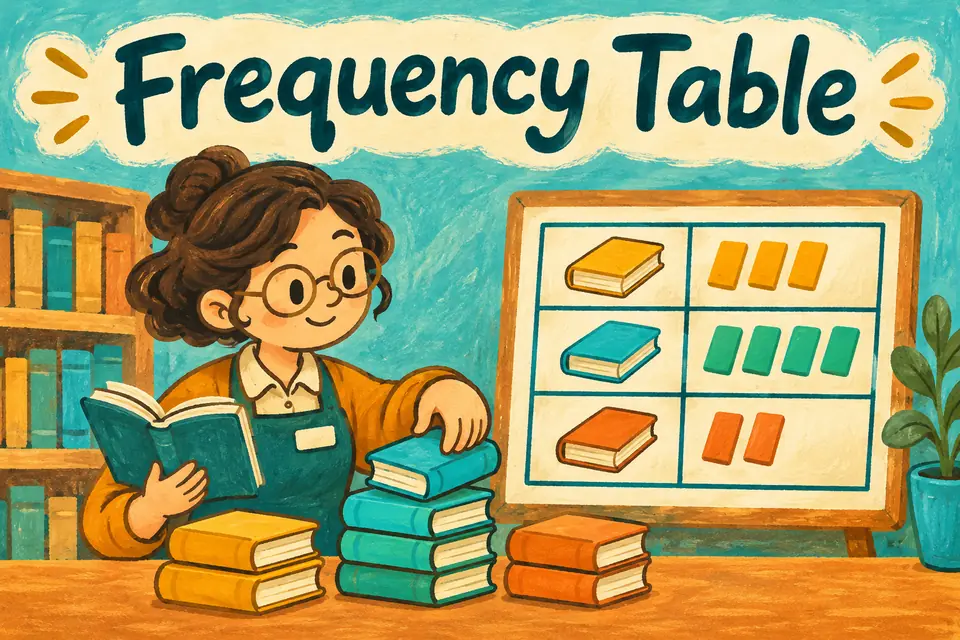
Frequency Table definition
A frequency table shows how many observations fall into each category or value. If four students choose blue, the frequency for blue is four.
Frequency Table in a picture
How it works
List nonoverlapping categories, then count each observation once. Frequencies should add to the total number of observations. Relative frequency divides each count by the total. Use counts for how many and relative frequencies for what share.
Worked examples
Make a table for 2, 3, 2, 5, 3, 2.
The frequencies are 3 for 2, 2 for 3 and 1 for 5. They add to 6.
Find the relative frequency for blue in the picture.
Divide 4 by 9, about 44.4%.
Find a missing frequency when the total is 20 and two groups have 7 and 8.
Subtract 7 + 8 from 20. The missing count is 5.
Common mistake
Use categories that do not overlap. In grouped data, define which bin receives values on a boundary.
Quick check
Three rows have counts 4, 6 and 8. What is the total?
Show answer
18.
The count is 5 of 20. What is the relative frequency?
Show answer
1/4 or 25%.
Does frequency mean count or percentage?
Show answer
Count. A percentage describes relative frequency.
Sources
Flashcard
Frequency Table
Reveal the definition
A frequency table shows how many observations fall into each category or value. If four students choose blue, the frequency for blue is four.
Effortless Math. “Frequency Table.” Math Dictionary.