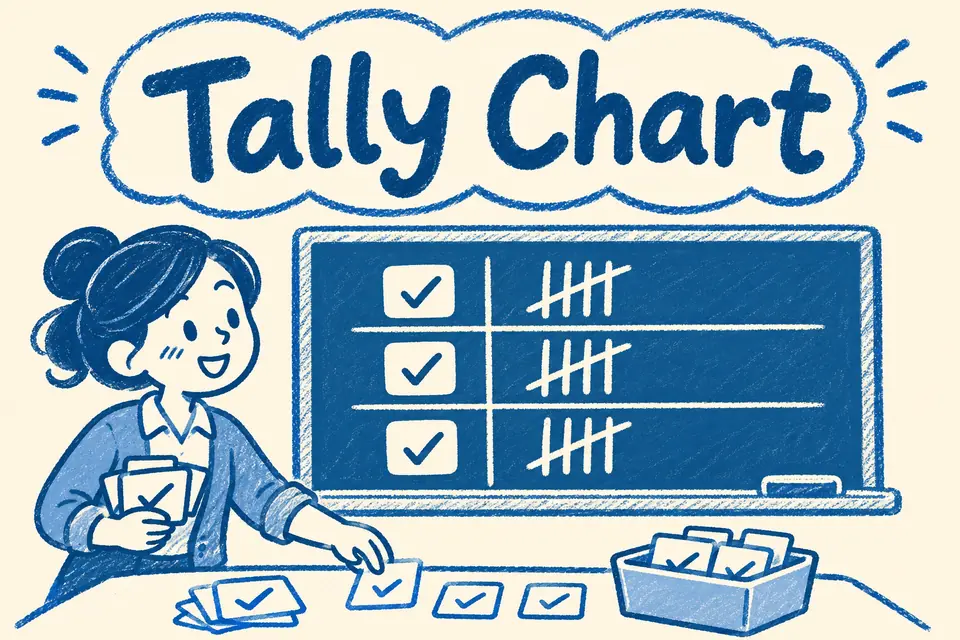
Tally Chart definition
A tally chart records counts as they happen. Each observation adds one mark in its category. Put every fifth mark across the previous four so you can count by fives.
Tally Chart in a picture
How it works
Keep one row per category. To find the frequency, multiply the number of complete groups by 5 and add the remaining marks. The completed chart can be turned into a frequency table or a graph.
Worked examples
Record six votes for apples.
Write one group of five and one extra mark.
Read two groups and three single marks.
Count 5 + 5 + 3 = 13.
Find the total in the picture.
Add seven apple votes and three pear votes to get ten.
Common mistake
The diagonal line is the fifth count. A finished group already represents five.
Quick check
How many marks form a complete group?
Show answer
Five.
What does one group and four singles mean?
Show answer
Nine observations.
Where does a new pear vote go?
Show answer
Add one mark in the pear row.
Sources
Flashcard
Tally Chart
Reveal the definition
A tally chart records counts as they happen. Each observation adds one mark in its category. Put every fifth mark across the previous four so you can count by fives.
Effortless Math. “Tally Chart.” Math Dictionary.