How to Graph the Cotangent Function?
Cotangent is one of the trigonometric ratios. In this step-by-step guide, you will learn more about the graph of the cotangent function.

Step-by-step guide to graphing the cotangent function
Cotangent is one of the basic trigonometric ratios. It is usually represented as \(cot x\), where \(x\) is the angle between the base and the hypotenuse of a right triangle. Alternative names of cotangent are cotan and cotangent \(x\).
The cotangent formula is:
\(\color{blue}{cot\:θ=\frac{Adjacent\:side}{Opposite\:side}}\)
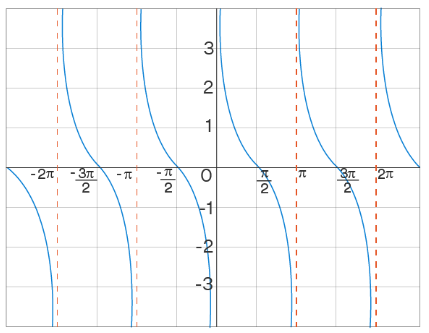
Since the cotangent function is not defined for integer multiples of \(π\), the vertical asymptote exists at all multiples of \(π\) in the cotangent graph. Also, the cotangent is \(0\) at all odd multiples of \(\frac{π}{2}\). Also, in an interval say \((0, π)\), the values of the cot decrease as the angles increase. So \(cot\) is a decreasing function. Then, the graph of the cotangent function looks like this.


Related to This Article
More math articles
- How to Analyze and Understand Rational Functions: A Comprehensive Guide
- How to Find the Polar Form of Complex Numbers?
- How to Represente Proportional Relationships with Equations
- 3rd Grade MCAS Math Practice Test Questions
- 7th Grade GMAS Math Worksheets: FREE & Printable
- Embark on Your ParaPro Math Mastery: Introducing the “ParaPro Math for Beginners” Companion eBook
- Math Made Easy: Essential Tips to Memorize Formulas and Supercharge Your Learning
- How to Sketch Trigonometric Graphs?
- The Ultimate 6th Grade FSA Math Course (+FREE Worksheets)
- Bеѕt Cаlсulаtоr fоr ACT Aspire Mаth Tеѕt


What people say about "How to Graph the Cotangent Function? - Effortless Math: We Help Students Learn to LOVE Mathematics"?
No one replied yet.