Trend Line definition
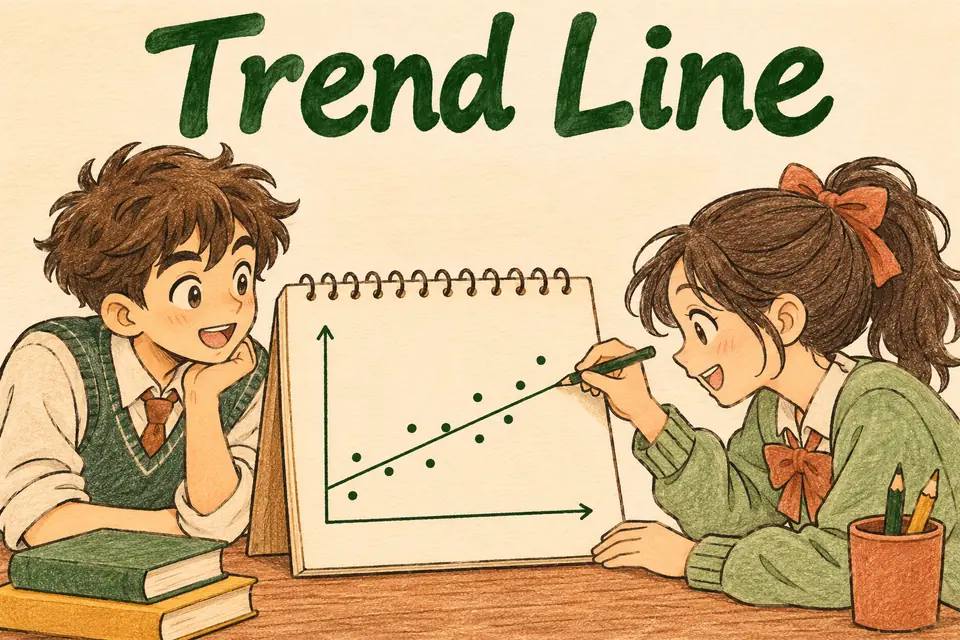
A trend line summarizes the general direction of a set of plotted data points.
Trend Line in a picture
How it works
A straight trend line on a scatter plot can be drawn by eye or computed with a method such as least squares. A positive slope indicates an upward tendency as x increases. A negative slope indicates a downward tendency. A trend line summarizes the pattern even when points do not all lie on it.
Worked examples
What does an upward trend line suggest?
Larger x-values generally go with larger y-values.
Must you connect the data points in order to draw a trend line?
No. It summarizes the whole group of points.
A trend line predicts 30 at x = 4. Is that guaranteed for every observation?
No. It is an estimate.
Common mistake
Look at the overall pattern. A line through one unusual point may miss the direction of most observations.
Quick check
Which sign of slope indicates a downward trend?
Show answer
Negative.
Can you draw an informal trend line by eye?
Show answer
Yes.
Does a trend line by itself prove cause?
Show answer
No.
Sources
Flashcard
Trend Line
Reveal the definition
A trend line summarizes the general direction of a set of plotted data points.
Effortless Math. “Trend Line.” Math Dictionary.