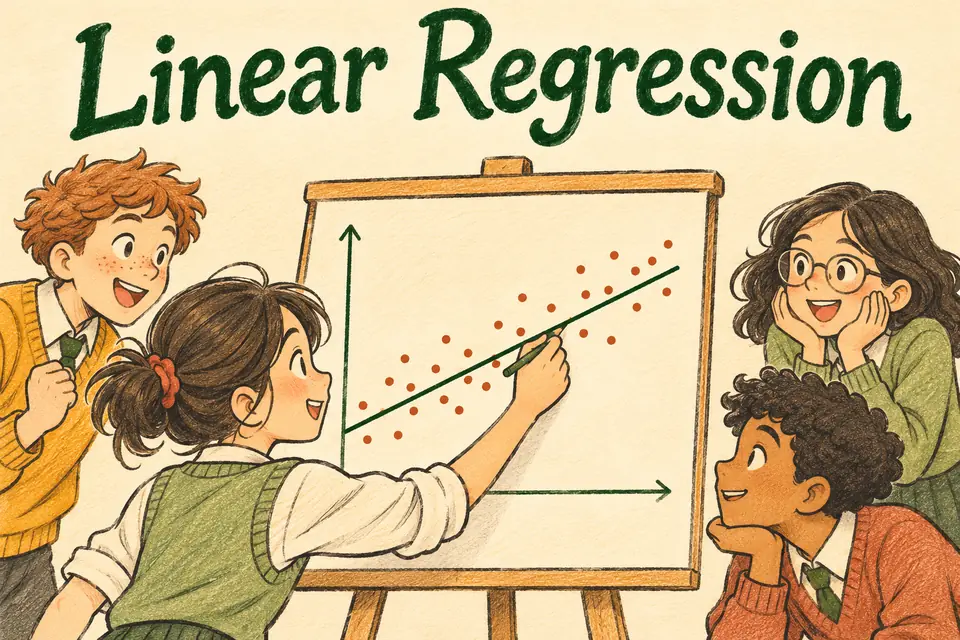
Linear Regression definition
Linear regression fits a line that describes how a response variable changes with an explanatory variable.
Linear Regression in a picture
How it works
For one predictor x, write the fitted line as ŷ = a + bx. The slope b gives the change in predicted y per unit increase in x. Ordinary least squares chooses a and b to minimize the sum of squared vertical residuals. Inspect the scatter plot and residuals to see whether a line is a reasonable description.
Worked examples
Predict y when x = 4 using ŷ = 2 + 3x.
The prediction is 14.
What does b = −2 mean?
The predicted response decreases by 2 for each unit increase in x.
The response at x = 4 is 16 and the prediction is 14. Find its residual.
16 − 14 = 2.
Common mistake
Avoid assuming cause from the fitted association. A line can fit observations without identifying why they vary.
Quick check
What is the symbol ŷ used for?
Show answer
A predicted response.
Does a regression line have to pass through every point?
Show answer
No.
What does ordinary least squares minimize?
Show answer
The sum of squared residuals.
Sources
Flashcard
Linear Regression
Reveal the definition
Linear regression fits a line that describes how a response variable changes with an explanatory variable.
Effortless Math. “Linear Regression.” Math Dictionary.