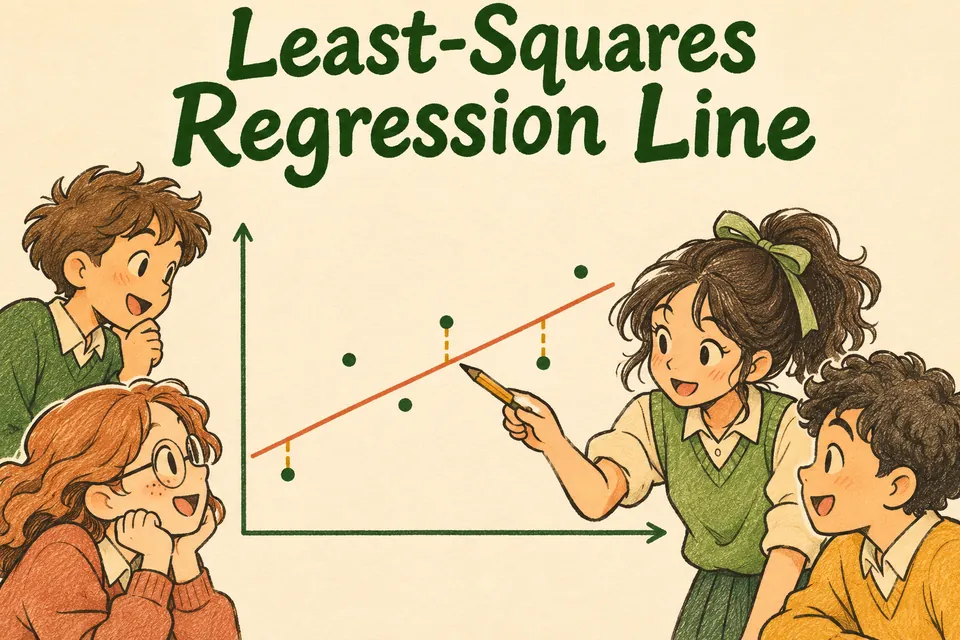
Least-Squares Regression Line definition
The least-squares regression line minimizes the sum of squared vertical differences between observed and predicted responses.
Least-Squares Regression Line in a picture
How it works
For each observation, the residual is y − ŷ. Square the residuals and add them to measure the line’s error. With an intercept and varying x-values, the fitted line passes through (mean x, mean y). Its slope equals the sum of cross-products of centered values divided by the sum of squared centered x-values.
Worked examples
Residuals are −1, 2, and −1. Find the squared error sum.
1 + 4 + 1 = 6.
For (1, 2), (2, 4), (3, 6), find the least-squares line.
ŷ = 2x gives zero residuals, the smallest possible sum.
The means are x̄ = 4 and ȳ = 11, and the fitted slope is 2. Find the intercept.
a = 11 − 2(4) = 3.
Common mistake
Measure residuals vertically, in the response variable’s units. Ordinary least squares does not minimize perpendicular distances.
Quick check
Why square residuals?
Show answer
Positive and negative errors cannot cancel after squaring.
What is the smallest possible squared error sum?
Show answer
Zero.
Which mean point lies on a least-squares line fitted with an intercept?
Show answer
(x̄, ȳ).
Sources
Flashcard
Least-Squares Regression Line
Reveal the definition
The least-squares regression line minimizes the sum of squared vertical differences between observed and predicted responses.
Effortless Math. “Least-Squares Regression Line.” Math Dictionary.