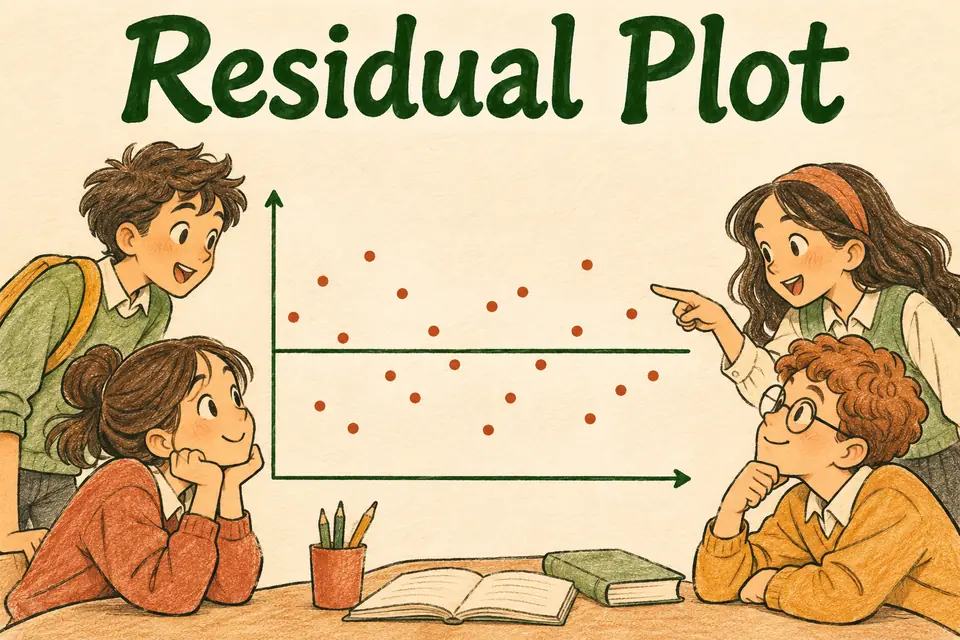
Residual Plot definition
A residual plot graphs a model’s residuals against predictor values, fitted values, or another relevant variable.
Residual Plot in a picture
How it works
Draw a zero reference line. Residuals above it are positive, and residuals below it are negative. A roughly patternless cloud with similar spread can support a linear model. Curvature suggests a missing relationship, and a widening band suggests changing error variance.
Worked examples
A residual plot has a clear U shape. What might be wrong?
The model may be missing curvature.
What can a fan-shaped spread suggest?
The variability of errors changes across the predictor range.
A plotted residual is −5. How was the prediction off?
The prediction was 5 units above the observation.
Common mistake
A patternless plot is one diagnostic. It does not guarantee the model is appropriate for every use.
Quick check
What does the vertical axis show?
Show answer
Residuals.
What does a point on the zero line mean?
Show answer
The predicted response equals the observed response.
Can a plot help reveal outliers?
Show answer
Yes.
Sources
Flashcard
Residual Plot
Reveal the definition
A residual plot graphs a model’s residuals against predictor values, fitted values, or another relevant variable.
Effortless Math. “Residual Plot.” Math Dictionary.