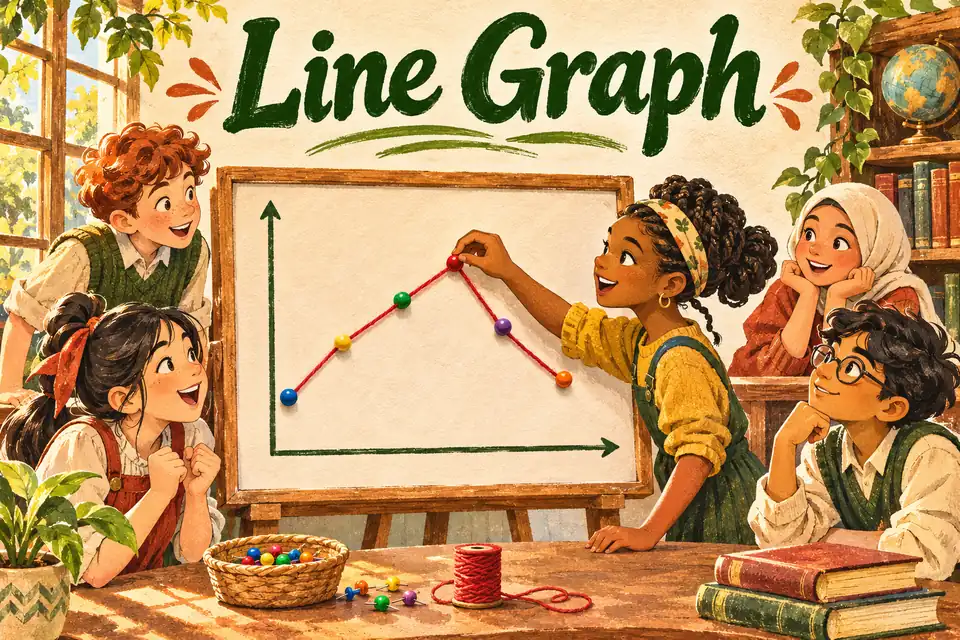
Line Graph definition
A line graph plots values as points and connects neighboring points to show change across an ordered horizontal variable.
Line Graph in a picture
How it works
A common example puts time on the horizontal axis and a measured value on the vertical axis. Read each axis and its scale before comparing points. The connecting line helps show a pattern between observations, but it does not automatically supply measured values there.
Worked examples
Scores go from 12 on Monday to 15 on Tuesday. What is the change?
An increase of 3.
If two consecutive plotted heights are equal, what does the joining segment look like?
Horizontal.
The line between two observations crosses a value of 7. Was 7 necessarily recorded?
No. It can be an intermediate value suggested by the line.
Common mistake
A line graph connects ordered data points. A classroom line plot usually stacks marks over values on a number line.
Quick check
What does a falling segment show?
Show answer
The plotted value decreases across that interval.
Can the horizontal scale use hours?
Show answer
Yes.
Should unequal time gaps appear equally spaced on a continuous time scale?
Show answer
No, show the actual spacing.
Sources
Flashcard
Line Graph
Reveal the definition
A line graph plots values as points and connects neighboring points to show change across an ordered horizontal variable.
Effortless Math. “Line Graph.” Math Dictionary.