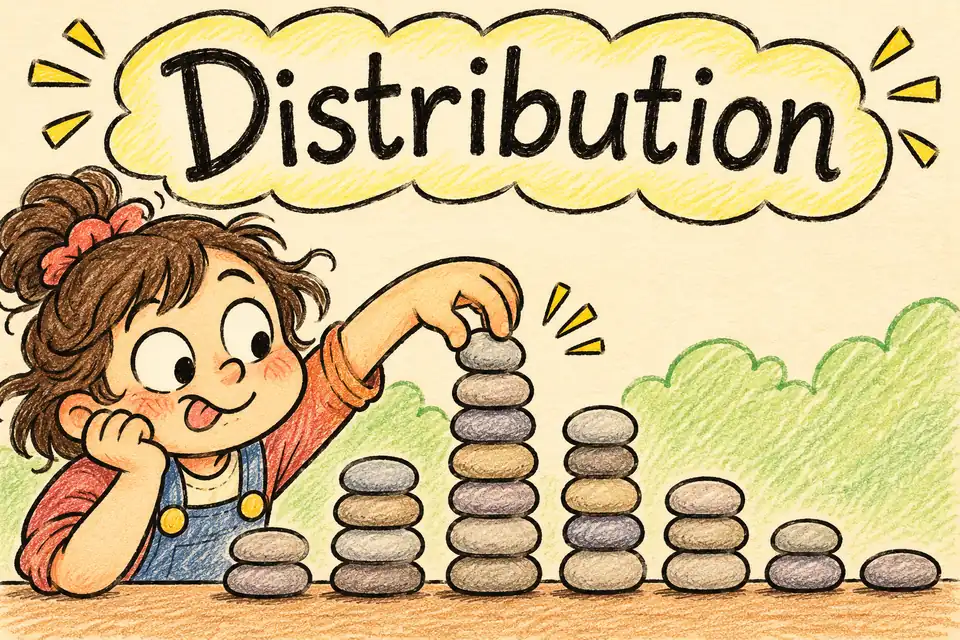
Distribution definition
A distribution describes what values a variable takes and how often they occur, or how probable they are.
Distribution in a picture
How it works
A frequency table or histogram can show how an observed data set is distributed. Look at its overall shape, typical values, spread, and any unusually isolated values. A probability distribution describes the possible outcomes of a random variable and their probabilities.
Worked examples
What does a bar of height 12 mean in a frequency histogram?
Twelve observations fall in that bar’s interval.
What does the highest bar tell you?
Its interval has the greatest frequency if the bins have equal widths and the axis shows frequency.
What does a fair coin’s probability distribution assign to heads and tails?
A probability of one half to each.
Common mistake
The distribution is the entire pattern. A mean or a single bar summarizes only part of that pattern.
Quick check
Can a frequency table describe a distribution?
Show answer
Yes.
Can two distributions have the same mean?
Show answer
Yes.
What does a distribution display besides the possible values?
Show answer
How often they occur or how likely they are.
Sources
Flashcard
Distribution
Reveal the definition
A distribution describes what values a variable takes and how often they occur, or how probable they are.
Effortless Math. “Distribution.” Math Dictionary.