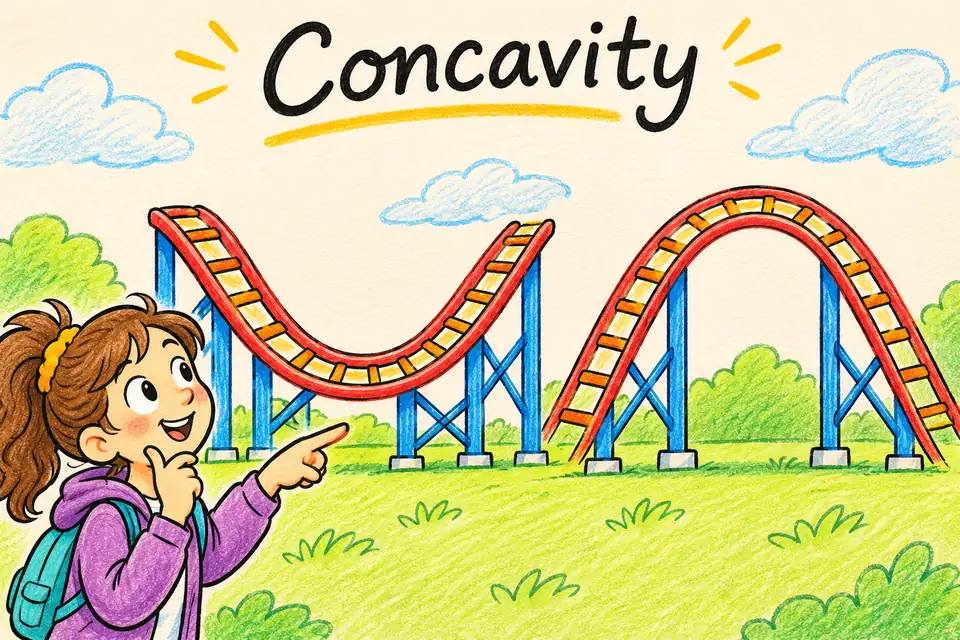
Concavity definition
Concavity describes how a graph bends. A differentiable graph is concave up where its slopes increase and concave down where its slopes decrease.
Concavity in a picture
How it works
Look at how f′ changes as x increases. If f″ is positive throughout an interval, f is concave up there. If f″ is negative throughout an interval, f is concave down there. Concavity concerns the change in slope, so a graph can rise and still be concave down.
Worked examples
Determine the concavity of f(x) = x².
Its second derivative is 2, so it is concave up everywhere.
Determine the concavity of f(x) = −x².
Its second derivative is −2, so it is concave down everywhere.
Find the concavity intervals of f(x) = x³.
The second derivative is 6x. It is negative for x < 0 and positive for x > 0.
Common mistake
A positive first derivative tells you the function is increasing. To tell how it bends, look at whether the slopes themselves are increasing or decreasing.
Quick check
What does f″ > 0 on an interval tell you?
Show answer
The graph is concave up there.
Can an increasing function be concave down?
Show answer
Yes, if its positive slopes are getting smaller.
What is a potential sign of a concavity change?
Show answer
The second derivative changes sign across a point where the function is continuous.
Sources
Flashcard
Concavity
Reveal the definition
Concavity describes how a graph bends. A differentiable graph is concave up where its slopes increase and concave down where its slopes decrease.
Effortless Math. “Concavity.” Math Dictionary.